You need to find out where your equipment costs are compared with others in your industry. One key way to do this is through benchmarking.
Do not discount someone else’s success. I have heard many client employees say, “Well, sure they can do that. They’re bigger than us… they don’t have the seasonal restrictions we do… or we have an older workforce.” And the capper: “Yeah, but their wages must be higher.”
And so it’s key to not only know where others are in your industry, but also know the best in class and world class averages. The construction industry has fairly inefficient maintenance practices, so just comparing yourself to other contractors may make you feel like the tallest person in the crowd, when all you are is the tallest pigmy in the tribe.

So if you have a 32 percent breakdown rate, and you’re just comparing it to the industry average of 31 percent, you think you’re doing fine. It’s much like observing the other swimmers in the water after the sinking of the Titanic and reassuring yourself you are doing relatively well in comparison. Instead of admiring your treading action, you should be swimming toward a boat.
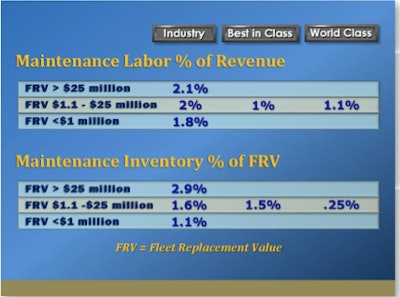
The following charts on cost and performance metrics represents a combination of data from the Association for Equipment Management Professionals (AEMP), Construction Financial Management Association (CFMA) and our own extensive database as fleet management consultants. Compare your costs and performance against others not only in your industry, but who are best in class and world class.


About the Author